Assays in multi-well plate formats have become very popular and are frequently employed in laboratories in different disciplines of the life sciences. Differential scanning fluorimetry (DSF) has become a popular method to rapidly identify low molecular weight ligands in multi-well formats that bind to the protein of interest. Based on Java classes developed within the Program Collection for Structural Biology and Biophysical Chemistry (PCSB), the Java application DSF Melting Analysis (DMAN) enables analysis of user-designed replica of DSF protein unfolding experiments in multi-well plates.
DMAN is a program to analyse protein thermal denaturation data obtained by multi-well differential scanning fluorimetry. Experimental repetition schemes on multi-well plates can be defined using an ASCII file or through a graphical user interface (GUI). The raw or pre-processed protein denaturation data are read by DMAN, and results of replica wells are averaged with the mean melting temperature and the estimate of standard deviation being calculated. Outliers in a set of replica are automatically excluded based on Grubbs' test using a probability threshold of 95%. The results are annotated to highlight wells that show a significant difference in melting temperature from a reference well, as well as the p-value for this difference determined by Welch's t-test. The melting curves and the location of determined inflection points can be graphically displayed for each set of replica; the user can also determine the inflection point interactively.
Data import
- Agilent/Stratagene Mx3005p raw data
- Applied Biosystems 7500 raw data
- Applied Biosystems 7900 raw data
- Applied Biosystems Step One raw data
- Applied Biosystems Step One Plus raw data
- Applied Biosystems ViiA7 raw data
- BioRad CFX96 raw data
- BioRad CFX384 raw data
- BioRad MyIQ raw data
- QuantStudio 7 Flex Real-Time PCR System
- Roche LC480 raw data
- Roche Protein Melt software output (*.csv)
- save/load DMAN sessions as binary file
Reports
- Results can be printed in table form (Results tab) and plate layout form (Plate tab)
- Results table (Results tab) can be copy-pasted to spreadsheet software
- Results table (Results tab) can be saved in various image file formats (PDF, PNG, SVG, TIFF)
- A PDF report of the Results can be generated
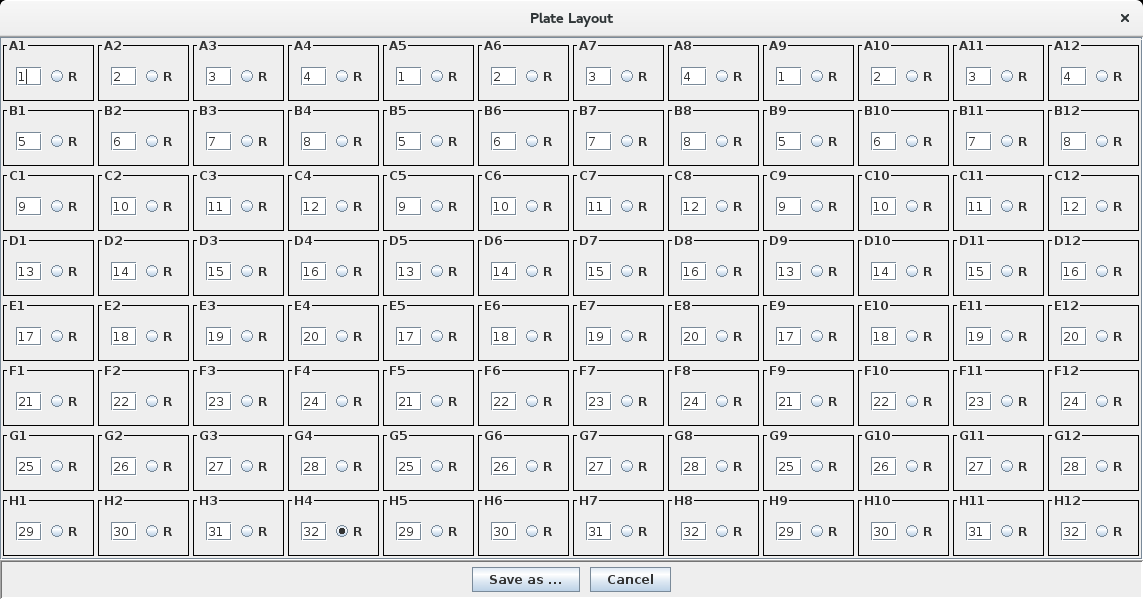
Plate layout setup
DMAN has three plate layouts built-in:

- 48 wells, triplicate repeats (DMAN file, Layout)
- 96 wells, triplicate repeats (DMAN file, Layout)
- 384 wells, quadruplicate repeats (DMAN file, Layout)
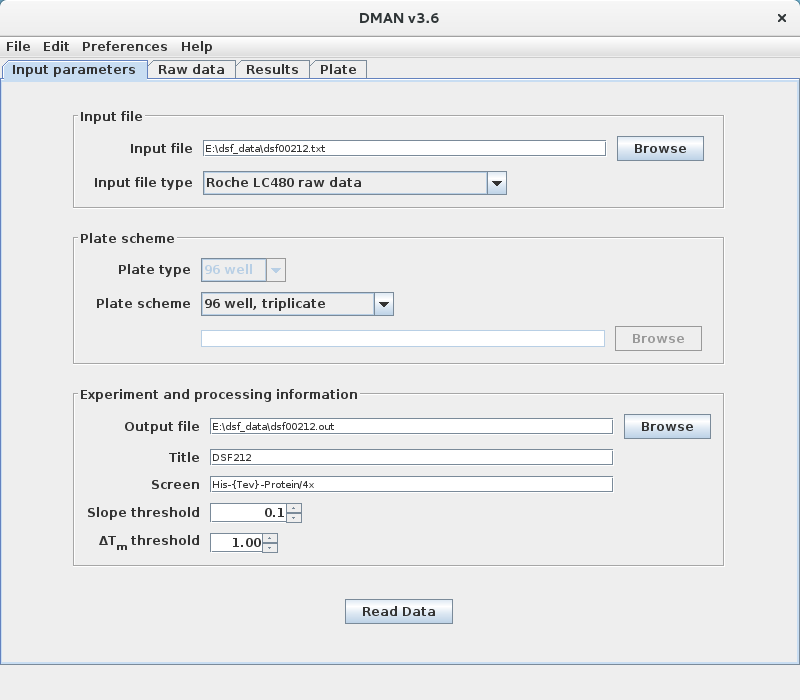
Input tab
Reading a Roche LC480 raw data file and a 96-well plate layout.

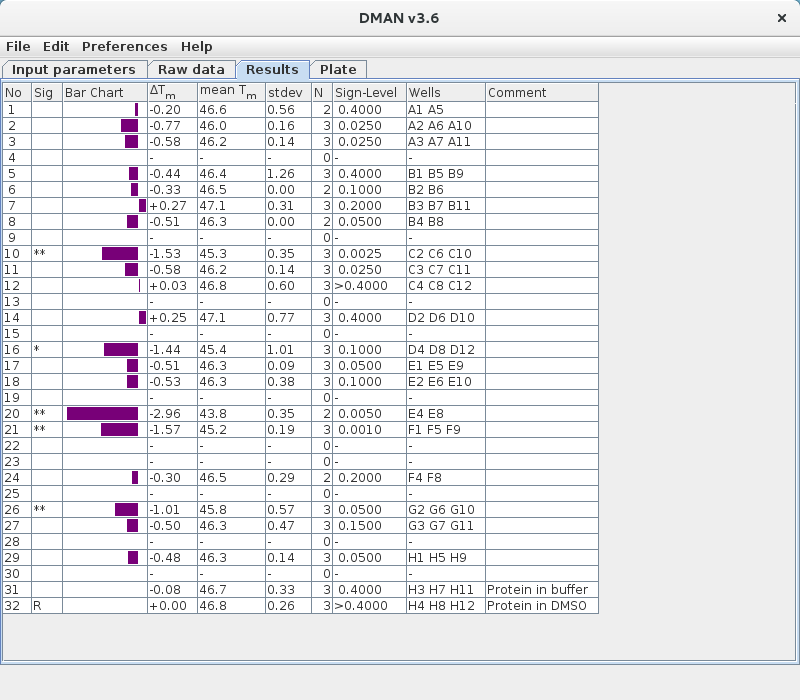
Results
Results are listed in the GUI as spreadsheet with bar graph under the Results tab.

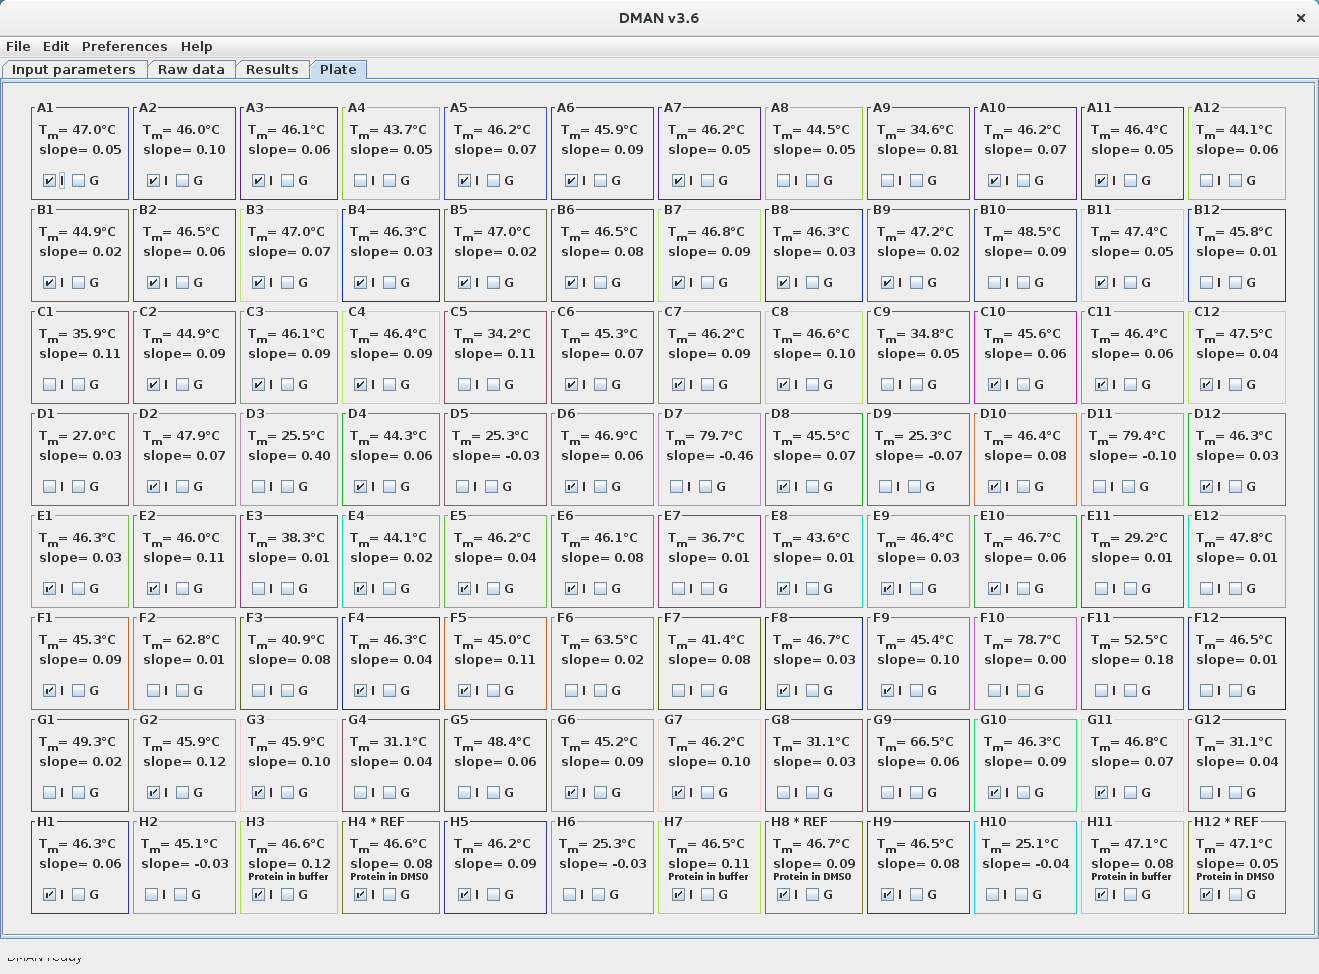
Results are also shown per well under the Plate tab.

An ASCII file with the analysis results is written automatically. The user needs to provide a file name as Output file in the Experiment and processing information under the Input parameters tab.
Results are also shown per well under the Plate tab.
An ASCII file with the analysis results is written automatically. The user needs to provide a file name as Output file in the Experiment and processing information under the Input parameters tab.
Tm analysis
DMAN automatically analyses individual curves for Tm and slope.
However, critical appraisal of automated data analysis is always recommended. Visual inspection of the individual experiments can be conveniently carried out by either clicking G of an individual well under the Plate tab. Alternatively, a mouse right-click in a table row under the Results tab brings up a plot of the replica experiments with the possibility to re-analyse.
The user can trigger re-analysis of individual curves by defining an area. Inclusion/exclusion of replica experiments is done with the tick boxes at the bottom of that window (or the I tick boxes of individual wells under the Results tab).
Three vertical lines coloured according to the individual replica experiments indicate the determined Tm values for those experiments. This feature can be turned on and off using the item Preferences from the menu bar.
Sample annotation
Annotation of samples can by either of the following:
- Annotation of a set of replica experiments by typing into the Comment column under the Results tab. Copy-paste from external spreadsheet software is possible.
- By annotating sets of replica experiments using the menu item Edit - Add comments to plate scheme.
- By including annotation of sets of replica experiments in a custom-made external plate scheme file.
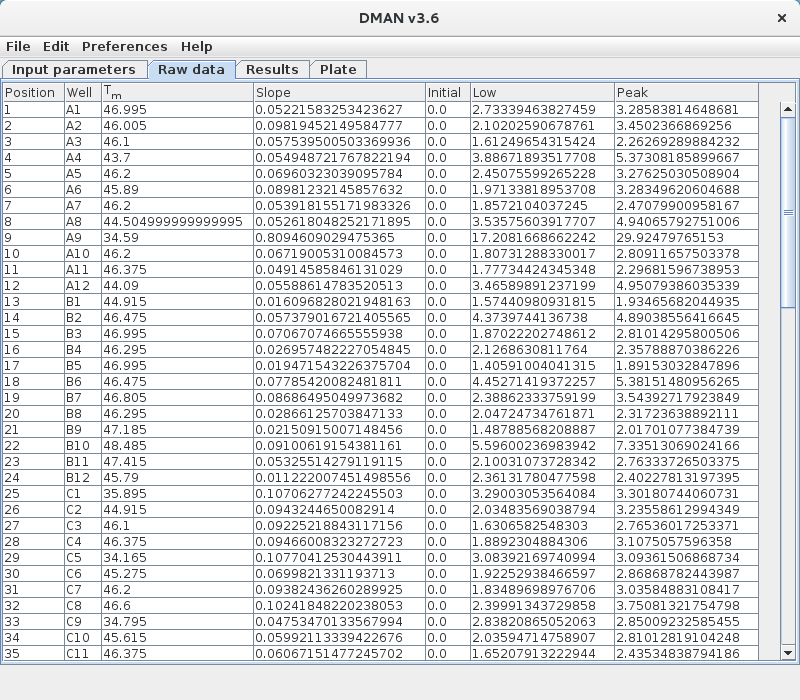
Raw data
The raw data are listed for reference under the Raw data tab.

When using this program, please cite:
Wang, C.K., Weeratunga, S.K., Pacheco, C.M., Hofmann, A. (2012) DMAN: a Java tool for analysis of multi-well differential scanning fluorimetry experiments. Bioinformatics 28, 439-440.