jBar is a Java GUI that allows the user to customise an included script for R. The scripted R pipeline calculates means and standard errors/deviations for replicates of numerical data collected in dependence of two variables, and presents the results in form of bar graphs. A two-sided Student’s t-test is carried out against a user-selected reference and p-values are calculated. The user can enter the data conveniently through the built-in spreadsheet and configure the R pipeline in the GUI. The configured R script is written into a file and then executed. Bar graphs can be generated as static PNG, PDF or SVG files as well as interactive Plotly HTML widgets.
This software has been designed as an analysis pipeline that calculates means and standard errors of replicate data collected in dependence of two variables (group and test). Additionally:
The GUI is available in English, French and German.
- one of the groups can be selected as a baseline to be subtracted
- one of the groups can be selected as reference for normalisation
- one of the groups can be selected as reference for Student’s t-test.
- R’s barplot function to generate PNG, PDF or SVG files
- the plotly package to produce HTML widgets.
The GUI is available in English, French and German.
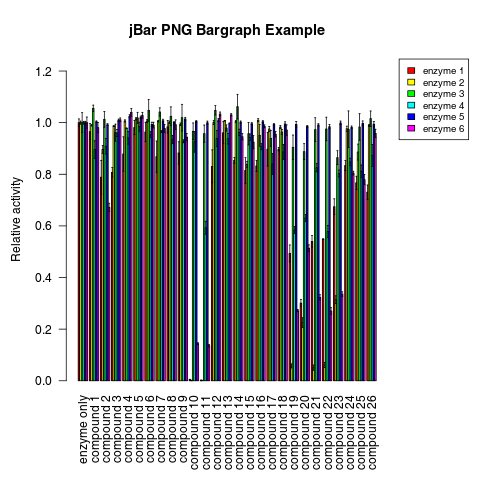
Bar graph per group
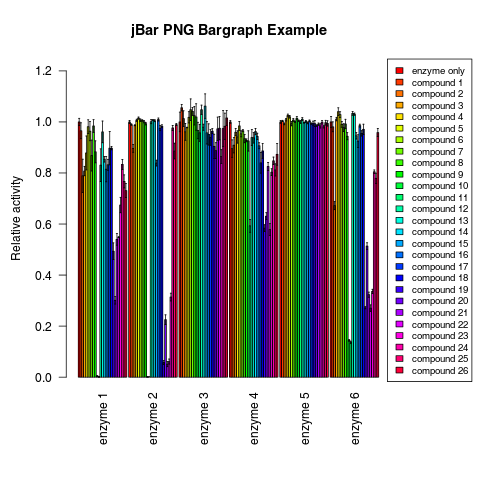
Bar graph per test
Data Input
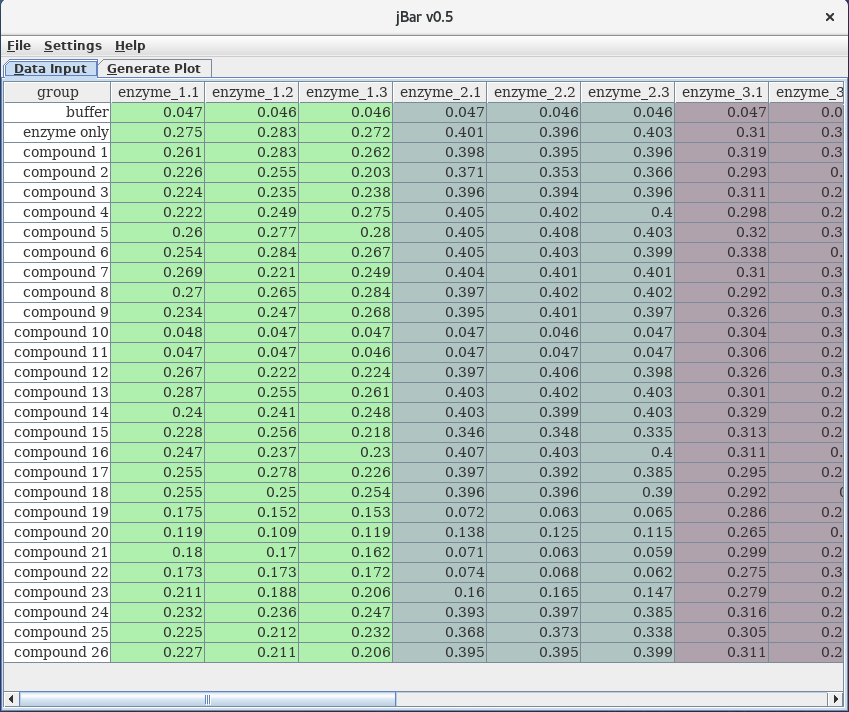 |
The Data Input spreadsheet tab provides a convenient way to assemble the data to be analysed. Data can be introduced by copy-paste (Ctrl-C / Ctrl-V) into the spreadsheet or entered manually in the individual cells. |
Generate Plot
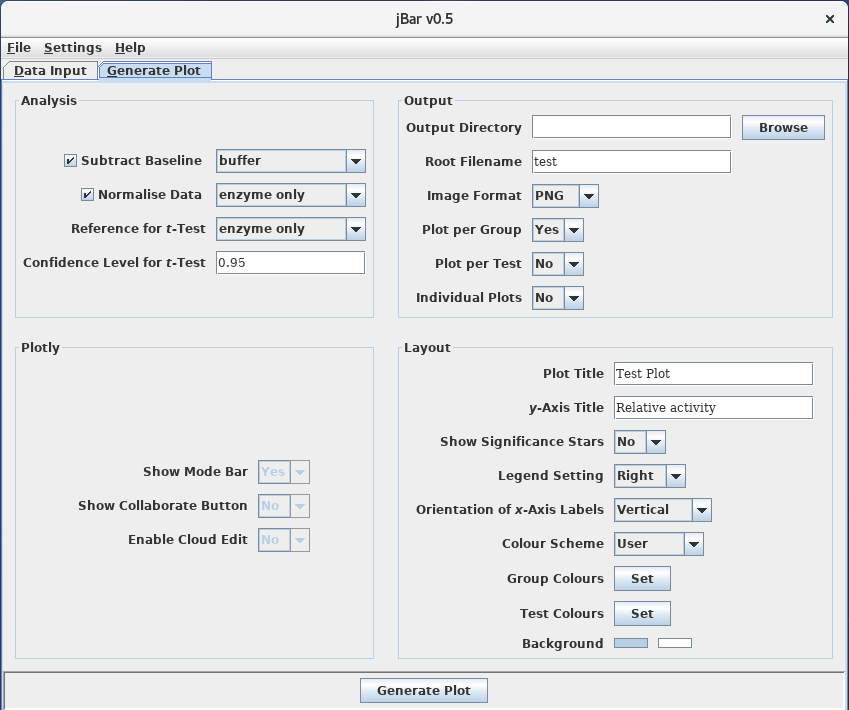 |
This panel allows setting of individual parameters of the R script. Selecting Plot per Group will produce a summary bargraph that uses the groups as categories on the x-axis and the tests will be shown in the legend. If Plot per Test is selected, the tests will be used as categories on the x-axis and the groups shown in the legend. It is also possible to produce individual plots where only one test is shown for all groups and/or one group is shown for all tests. The colouring of individual graphs will be consistent with the colours in the summary graphs. |
Results
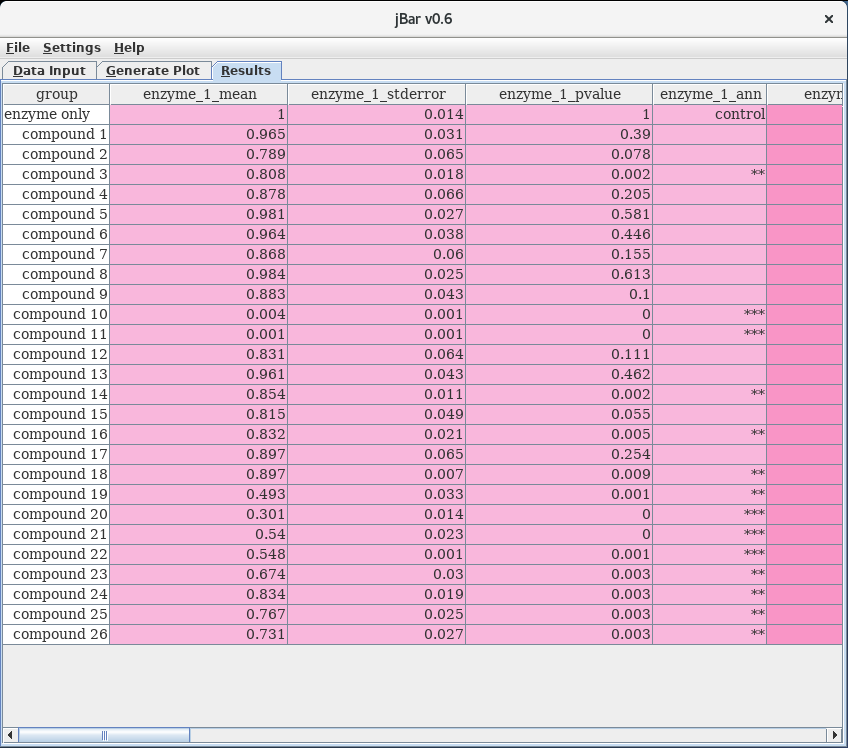 |
Upon completion of the R calculation, the contents of the results file are read and displayed in the spreadsheet of the Results tab. In this spreadsheet, columns labeled with _ann contain the annotation used in the bar graphs. Cells in these columns can be edited by the user, providing a way of manually entering the desired annotation for individual data points. When generating a new plot by clicking on the Generate Plot button of the Generate Plot tab, the annotation in the bar graphs is amended accordingly. |
In order to assess the effects of potential inhibitors on the activity of an enzyme, a biochemical assay is carried out in the absence and presence of various compounds; this variation is captured by the group variable. The enzymes being tested are captured by the test variable. Each test is carried out with technical repeats (e.g. in triplicate: test.1, test.2, test.3).
For analysis of this data model, the following steps will be carried out:
- If selected by the user (Subtract Baseline), the mean of the baseline group for each test will be subtracted from the data of that test.
- If selected by the user (Normalise Data), all groups of a particular test will be normalised with respect to the reference of that test.
- For each set of replica of a particular test, the mean and standard error of the mean will be calculated.
- For each test, a two-sided Student t-test (95% confidence level) is done against the reference group (Reference for t-Test) and the p-value recorded.
When using this program, please cite:
Hofmann, A., Cross, M., Karow, M.A., Straub, J.H., Clemen, C.S., Eichinger, L. (2019) A convenient tool for bivariate data analysis and bar graph plotting with R. Biochem. Mol. Biol. Edu. 47, 207-210.